
Usage Guide
AgentsView serves a full-featured web application for browsing, searching, and analyzing your AI agent sessions. This page walks through every part of the interface.
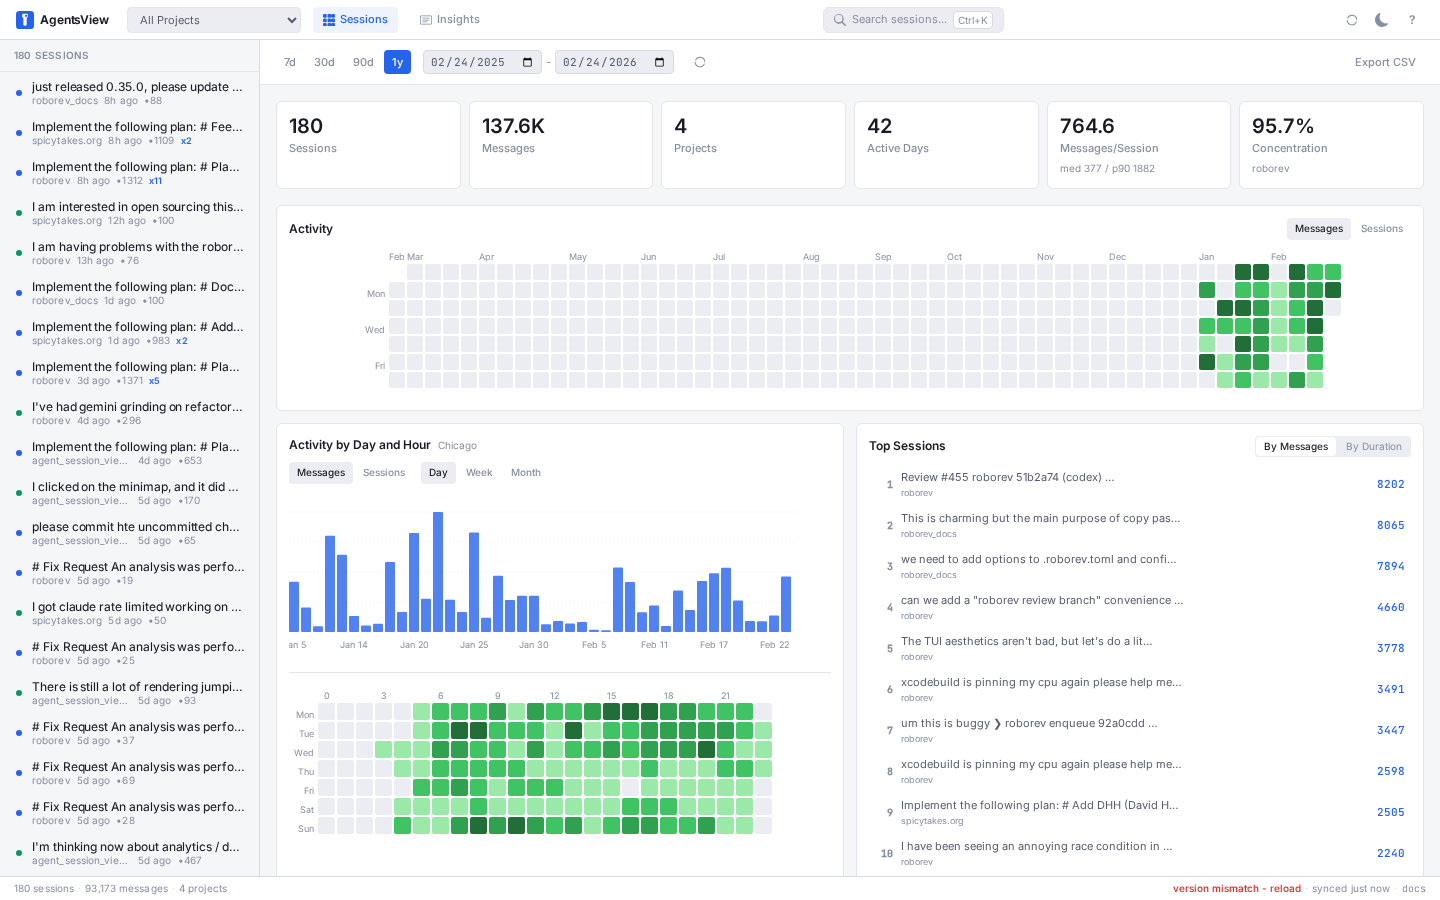
Dashboard
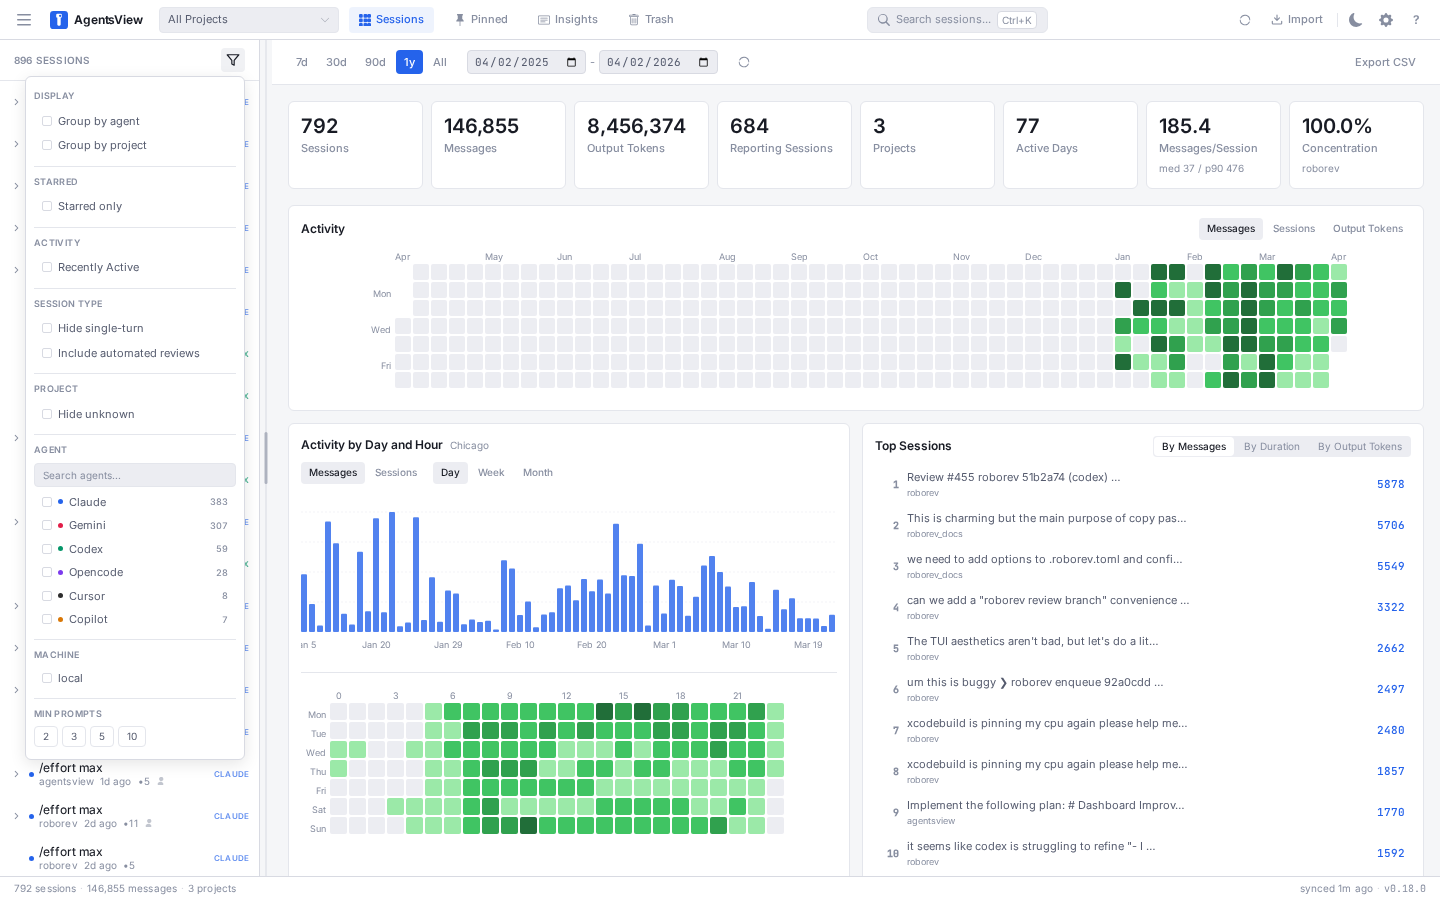
When you open AgentsView with no session selected, you see the analytics dashboard. It provides a high-level overview of your agent activity across all projects.
The dashboard header includes:
- Project filter — typeahead to scope everything to a single project. Type to filter by name; each entry shows its session count. Navigate with arrow keys, select with Enter, and close with Escape.
- Search bar — opens the command palette (
Cmd+K) - Sync button — triggers a manual sync of session files
- Theme toggle — switch between light and dark mode
- Import button — opens the Chat Import dialog for importing Claude.ai or ChatGPT conversations
- Shortcuts button (
?) — shows all keyboard shortcuts
The status bar at the bottom shows session count, message count, project count, last sync time, and the build version.
Summary Cards
Six cards at the top of the dashboard show key metrics for the selected date range:

| Card | Description |
|---|---|
| Sessions | Total session count |
| Messages | Total message count |
| Projects | Number of active projects |
| Active Days | Days with at least one session |
| Messages/Session | Average with median and p90 |
| Concentration | Most active project and its share |
Date Range Picker
Quick presets for 7 days, 30 days, 90 days, 1 year, and All, plus custom start/end date inputs. The All preset shows every session regardless of age. All charts update when the range changes.

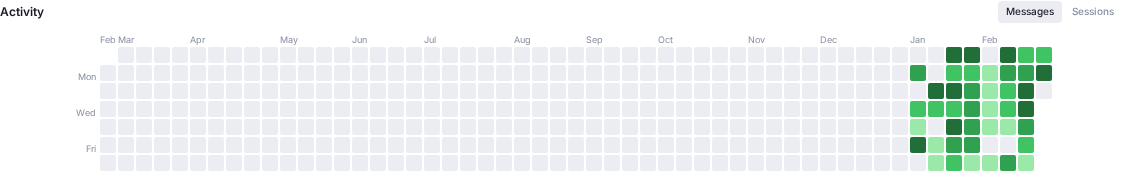
Activity Heatmap
A GitHub-style contribution graph showing daily activity. Toggle between message count and session count.
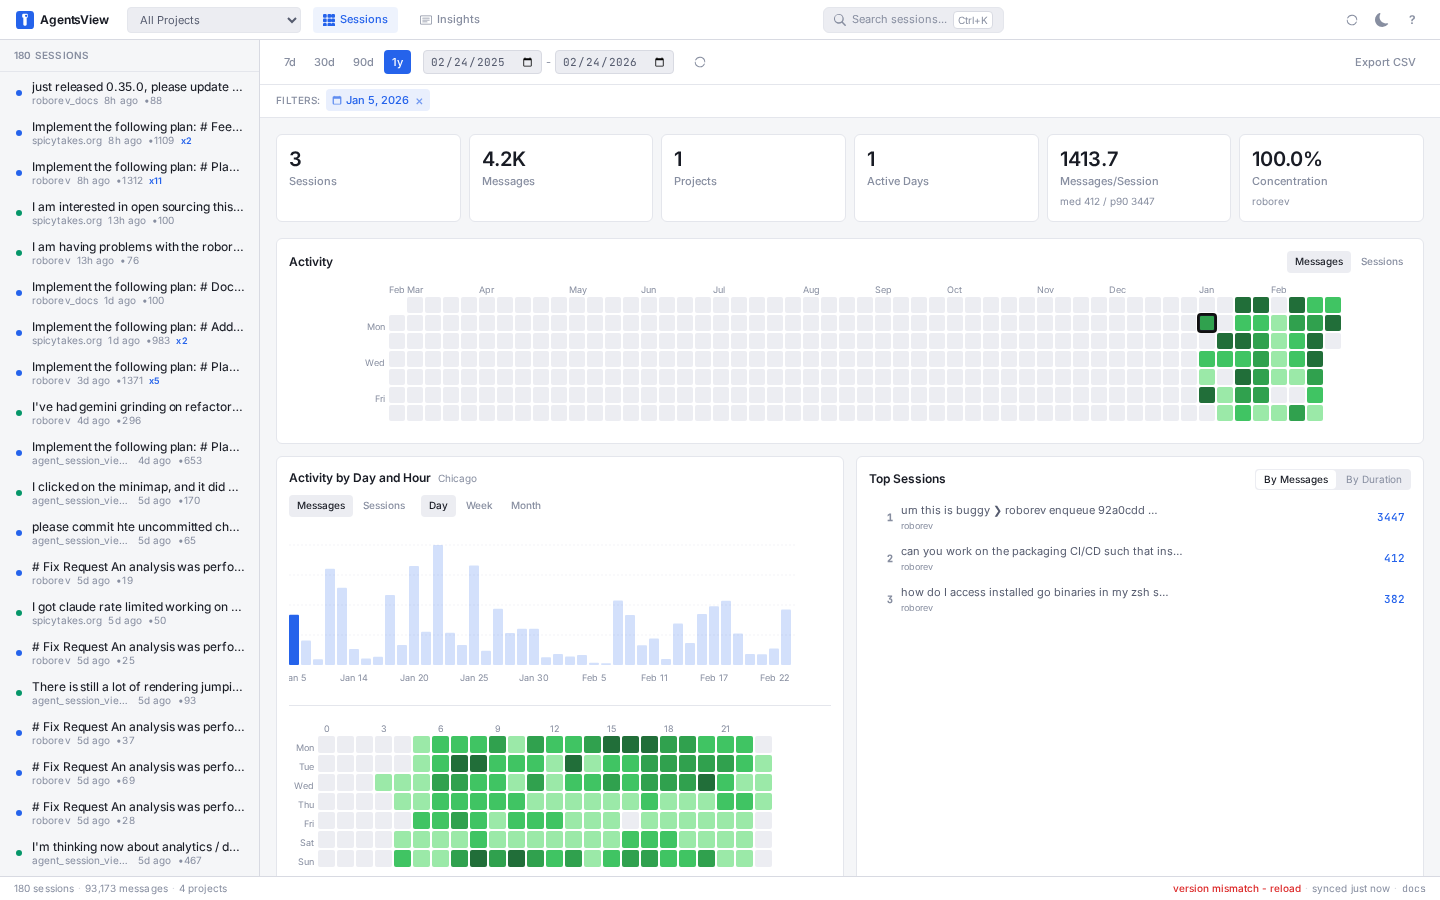
Click-to-Filter
Click any heatmap cell to filter all charts and the session list to that single day. The selected cell gets a highlighted border, and an active filter chip appears in the toolbar. Click the same cell again (or dismiss the filter chip) to deselect.
Hour of Week Heatmap
A 7x24 grid showing when you use agents most. Rows are days of the week, columns are hours. Color intensity represents message volume.
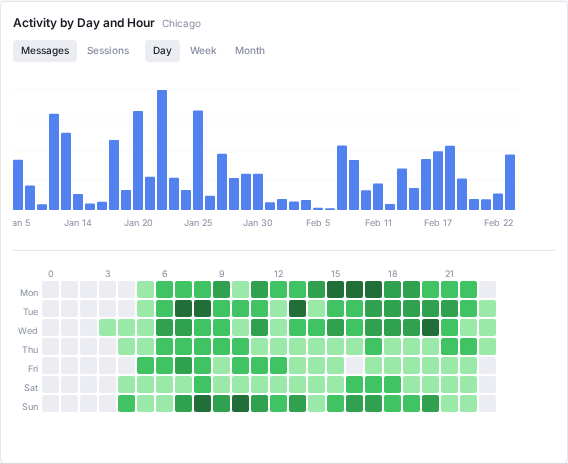
Activity Timeline
A stacked chart showing messages, sessions, tool calls, and thinking blocks over time. Toggle between daily, weekly, and monthly granularity. Includes breakdown by agent.
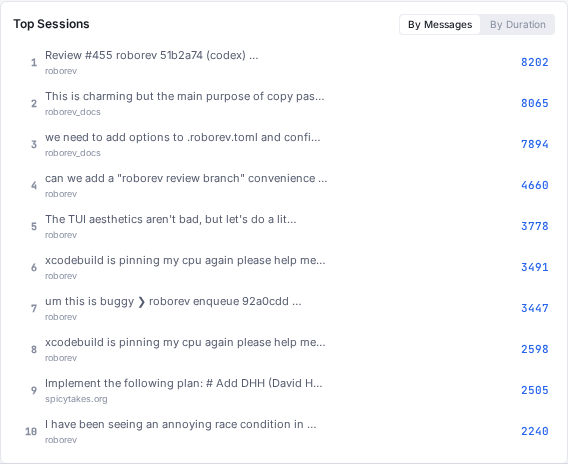
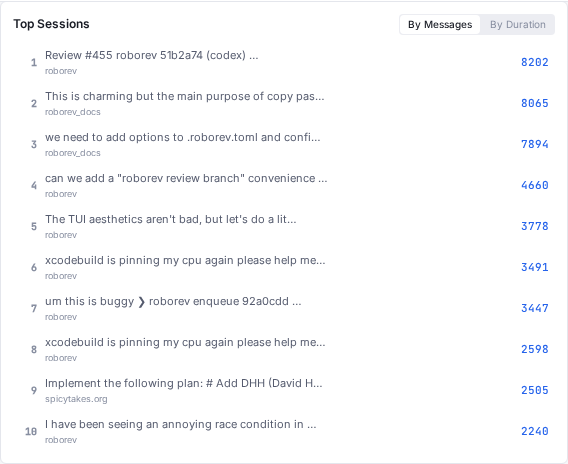
Top Sessions
A ranked list of your longest sessions by message count or duration. Click any session to jump directly to it in the session viewer.
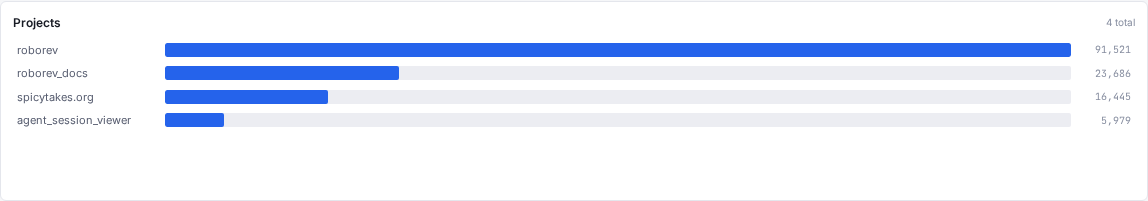
Project Breakdown
Bar chart of all projects sorted by session or message count. Shows average and median messages per session for each project. Click any project bar to filter the dashboard and session list to that project.
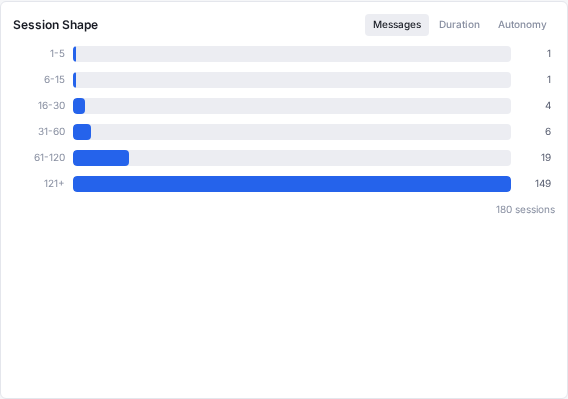
Session Shape Distribution
Three histograms showing the distribution of:
- Session length — number of messages per session
- Session duration — time in minutes
- Session autonomy — ratio of tool calls to conversation turns
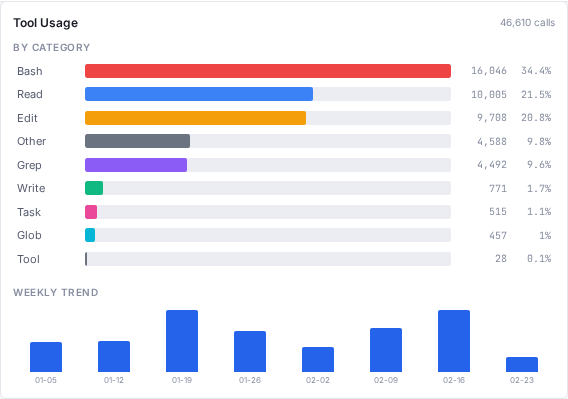
Tool Usage
Total tool call count with breakdowns by category (Read, Edit, Write, Bash, Search, Web, Task) and by agent. Includes a trend chart showing tool usage over time.
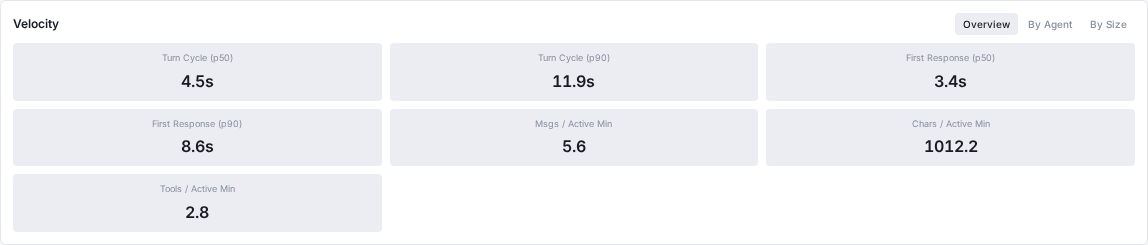
Velocity Metrics
Performance metrics including:
- Turn cycle time (p50, p90)
- First response time (p50, p90)
- Messages, characters, and tool calls per active minute
- Breakdown by agent and by session complexity
Agent Comparison
Side-by-side metrics across agents: session count, total messages, average response time, tool usage patterns, and concentration metrics.

CSV Export
Click Export CSV in the dashboard toolbar to download all analytics data as a CSV file. Includes summary, activity, projects, tools, and velocity sections.
Session Insights
AgentsView can generate AI-powered summaries and analysis of your coding sessions using Claude, Codex, Copilot, or Gemini. Click Insights in the header navigation bar to open the Insights page, where you can generate daily activity digests, multi-day summaries, and deeper analyses of your agent workflow patterns — scoped by project or across everything.
See the Session Insights page for full documentation.
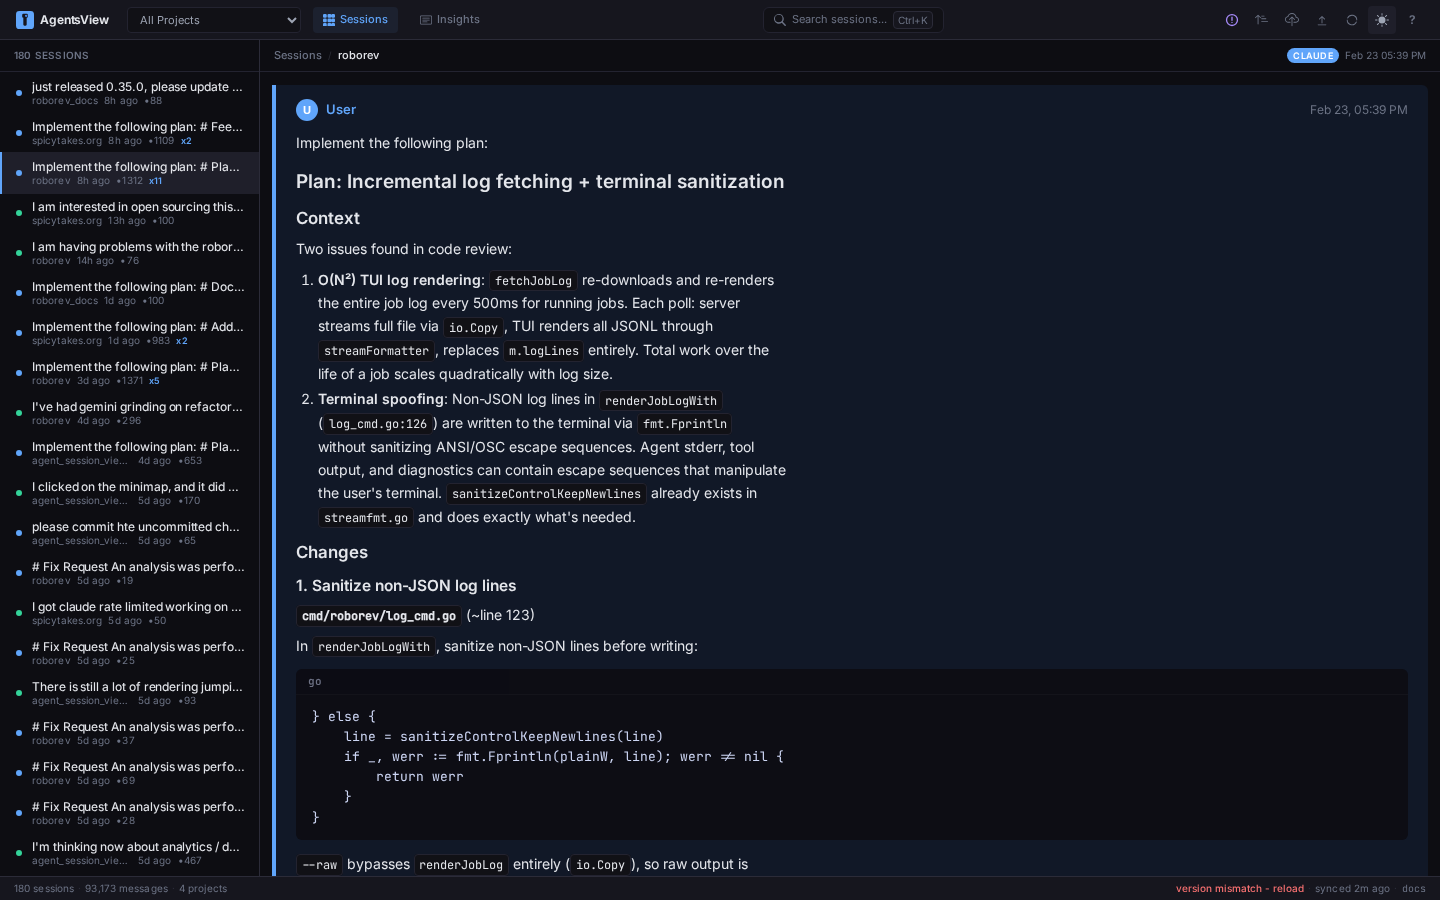
Session Browser
The left sidebar lists all sessions with virtual scrolling for smooth performance even with thousands of sessions. On desktop, drag the resize handle between the sidebar and the content pane to adjust the sidebar width. The width is constrained between 220px and 520px, always leaving at least 480px for the content area. Your preferred width is saved in localStorage and restored on next visit.
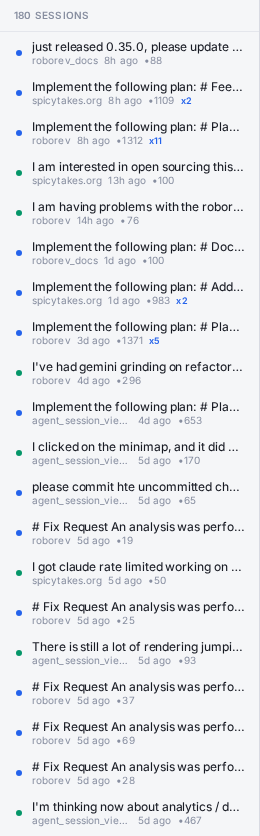
Each session item shows:
- Agent indicator — color-coded dot and agent name label in the agent’s accent color. Recently active sessions show a glowing animation.
- Session name — display name if set, otherwise first message text truncated to 50 characters. OpenCode sessions use their native session titles.
- Model name — the AI model used for the session, shown when available (including Codex session models).
- Star button — click the star icon or press
sto star a session. Starred sessions persist in the SQLite database so they survive server restarts. - Machine label — when using PostgreSQL sync, sessions from other machines show a machine name tag. Only visible in shared multi-host deployments.
- Project name — abbreviated, right-aligned
- Relative time — “2h ago”, “Mon”, “Dec 1”
- User prompt count — number of user messages in the session
Group by Agent
Click the group-by-agent toggle in the sidebar header to organize sessions into collapsible sections by agent type. Each agent group shows a color-coded dot, agent name, and session count. Click an agent header to expand or collapse its section. Groups start collapsed when first enabled.
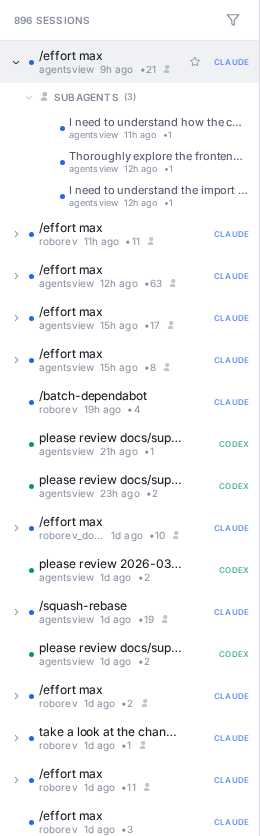
Sub-Agent Tree
When a session spawns sub-agents or teams, the sidebar organizes them in a collapsible tree view. Parent sessions show a disclosure triangle; click to expand and see child agents nested underneath. This makes complex multi-agent workflows easier to navigate without leaving the session list.
Forks and Subagent Sessions
AgentsView automatically detects conversation forks in Claude Code sessions — for example, when you use “retry from here” to branch a conversation. Large forks (more than 3 user turns) appear as separate session entries grouped with their parent. Small retries fold into the main session.
Subagent sessions spawned by the Task tool are organized under their parent in the sidebar’s sub-agent tree and are also viewable inline through the parent session’s tool blocks (see Subagent Linking below).
Session Filters
Click the filter icon next to the session count to open a dropdown with three filter categories that can be combined:
- Starred — toggle to show only starred sessions
- Recently Active — toggle to show only sessions updated within the last 24 hours
- Agent — select one or more supported agents to filter sessions. Click an agent to toggle its selection; multiple agents can be active at once.
- Min Prompts — filter to sessions with at least 2, 3, 5, or 10 user messages
- Include single-turn — toggle to include sessions with one or fewer user messages (excluded by default to reduce noise)
- Hide unknown — toggle to hide sessions whose project could not be determined
When any filter is active, a green dot appears on the filter button. Click Clear filters at the bottom of the dropdown to reset all filters at once.
Filter state syncs between the session sidebar and the analytics dashboard — applying a filter in one updates the other.
Direct Session Links
Each session has a shareable URL. Click the session ID in the detail header to copy the link, or use the URL bar directly:
/sessions/550e8400-e29b-41d4-a716-446655440000Session URLs work as bookmarks and can be shared with teammates when using PostgreSQL sync for shared deployments.
URL Filters
URL parameters are supported for direct linking:
/sessions?project=myapp&agent=claude&date_from=2025-01-01Available URL filters: project, agent, date, date_from,
date_to, min_messages, max_messages,
min_user_messages, active_since, exclude_project.
Navigation
Use ] and [ to move between sessions in the list. The
selected session is highlighted with a left border accent.
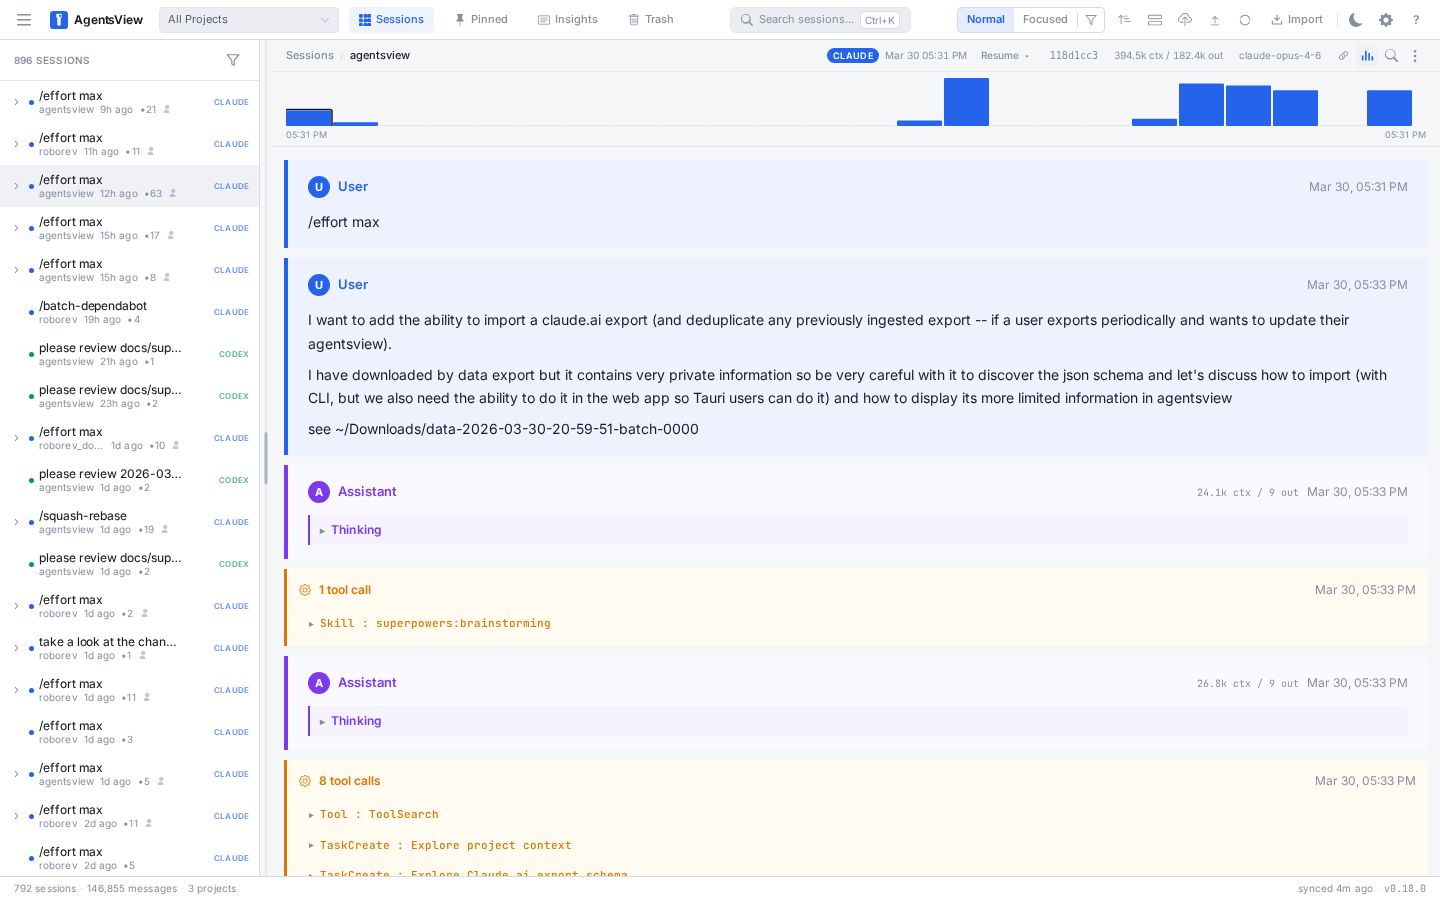
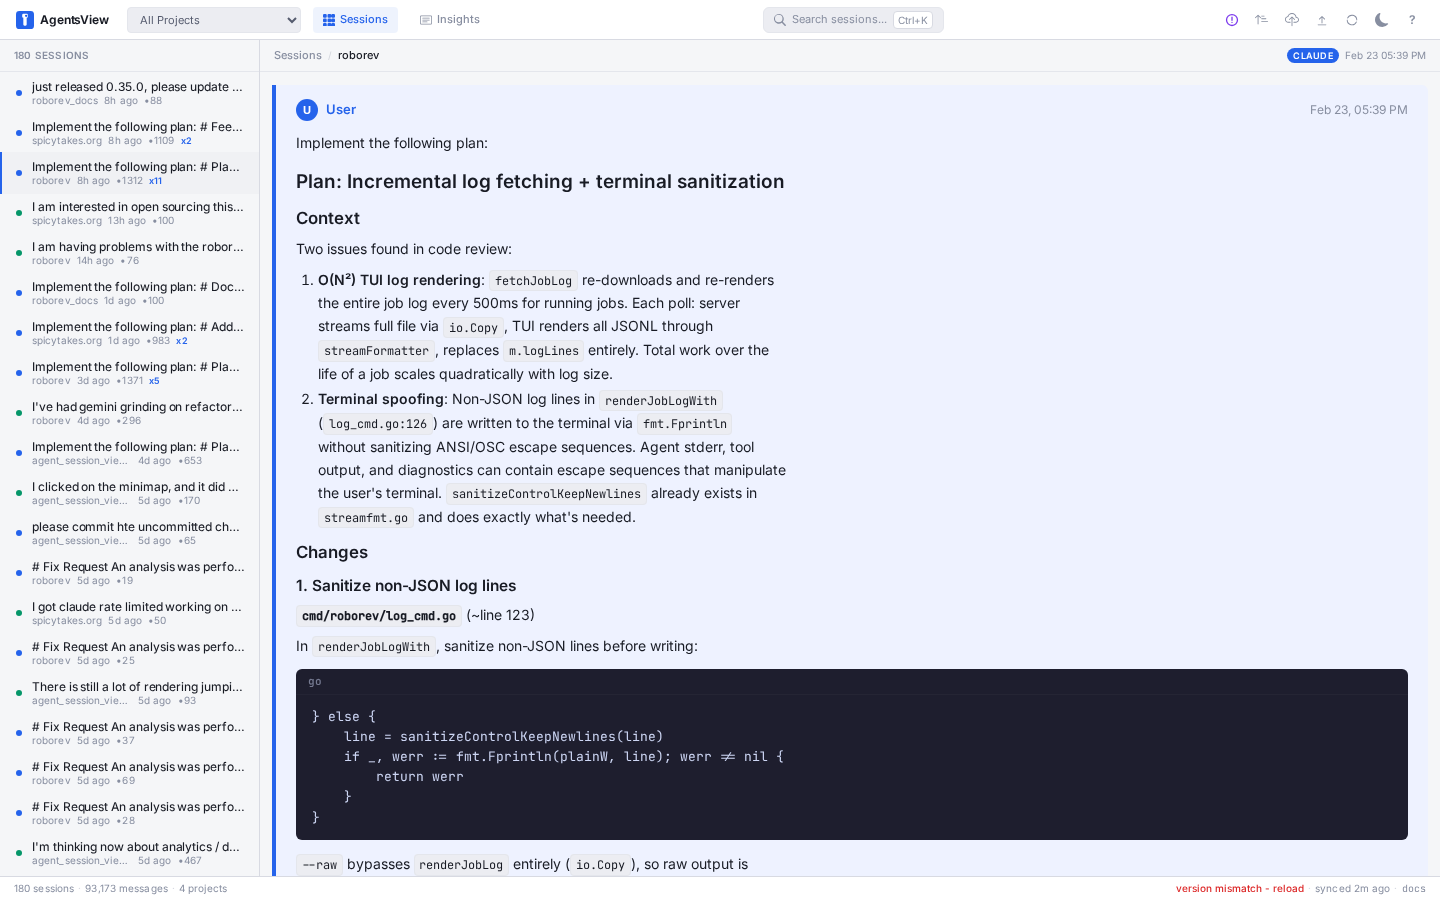
Message Viewer
Selecting a session opens the message viewer in the main content area. Messages display in a scrollable list with virtual rendering for large sessions.

The session detail header shows the session name, agent, project, and a copyable Session ID. Click the ID to copy it to the clipboard for sharing or lookup.
Message Layouts
Three layouts control how messages are rendered. Cycle between
them with the l key or the layout button in the header:
| Layout | Description |
|---|---|
| Default | Full card layout with colored borders and spacing |
| Compact | Condensed view with minimal spacing |
| Stream | Continuous flow optimized for reading |
Focused Transcript Mode
Focused mode strips intermediate tool calls, thinking blocks, and partial assistant messages, showing only user prompts and final assistant responses. This makes long sessions easier to read as a clean conversation transcript.
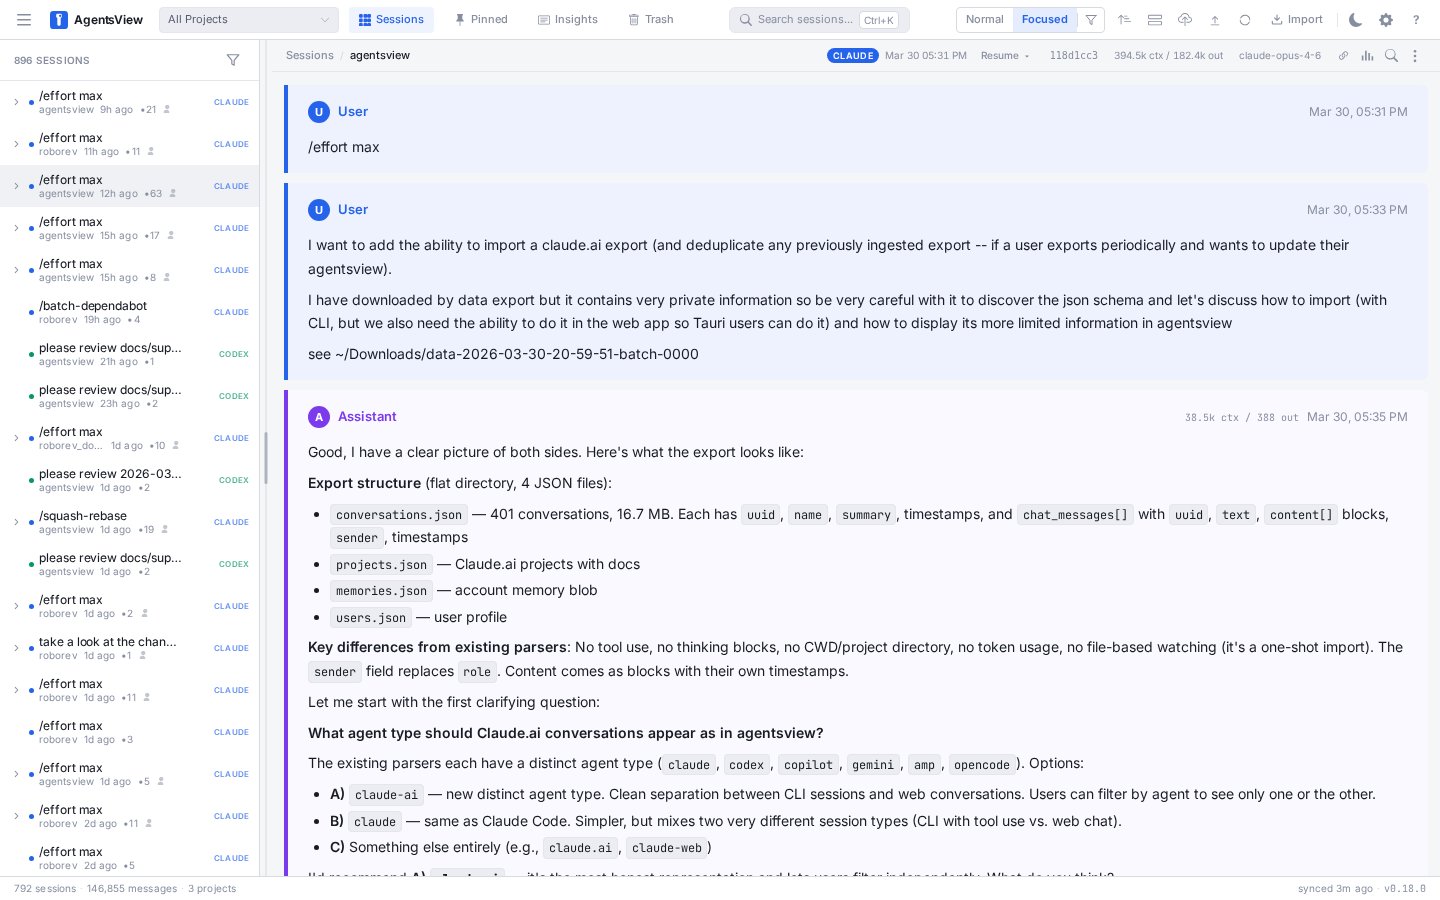
Toggle between Normal and Focused mode using the transcript mode button in the session header. The header adjusts responsively to fit the available space. The mode preference is saved in localStorage.
Message Display
Each message has a colored left border indicating role:
- Blue — user messages
- Purple — assistant messages
The header shows the role label, timestamp, and a copy button that appears on hover. Click it to copy the full message content to the clipboard — a checkmark confirms the copy for 1.5 seconds.
Thinking Blocks
Assistant thinking blocks appear as collapsible sections with a purple left border. Toggle visibility for thinking blocks using the block-type filter in the header.
Tool Blocks
Tool invocations display as collapsible amber-bordered sections showing the tool name, arguments, and output. When collapsed, a preview of the first 80 characters is shown.

When expanded, tool blocks display structured metadata tags extracted from the tool call input. For task management tools (TaskCreate, TaskUpdate, TaskGet), these tags show the task subject, status, and ID at a glance. Bash tool blocks show the full command text, including multi-line commands like heredocs that would otherwise be truncated. Tool result content is stored alongside the tool call when available, giving a complete view of input and output.
Codex tool calls receive special formatting: bash commands, write_stdin operations, and apply_patch calls display with structured argument previews and categorized detail labels.
When a Codex tool call has subagent result events — status updates captured during execution — an expandable history section appears below the tool output. Click it to see the full chronological timeline of status changes (e.g. “wait”, “completed”, “failed”) with source and content for each event. The latest event summary is shown by default.
Subagent Linking
When a Task or Agent tool block is linked to a subagent session, it shows an expandable toggle. Click it to view the subagent’s full transcript inline without leaving the parent session. Messages load on demand when the section is expanded, showing the complete subagent conversation with role labels and timestamps.
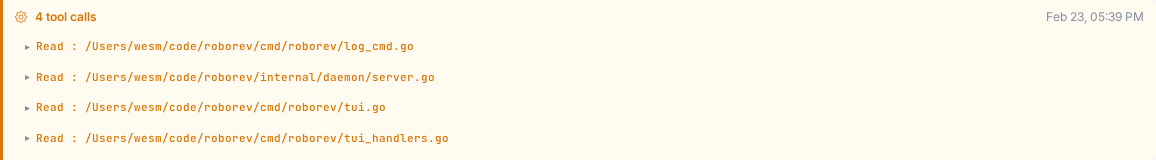
Tool Call Groups
Consecutive tool-only assistant messages are grouped into compact “N tool calls” sections with a gear icon and timestamp. Click to expand individual tool blocks within the group.
Code Blocks
Fenced code blocks render with language labels, monospace formatting, and horizontal scrolling for long lines.
Block-Type Filtering
Click the filter icon in the message viewer header to open a dropdown that toggles visibility of five content categories:
| Category | What It Controls |
|---|---|
| User | User messages |
| Assistant | Assistant responses |
| Thinking | Thinking/reasoning blocks |
| Tool | Tool call blocks |
| Code | Code blocks |
All categories are visible by default. When any are hidden, a badge on the filter button shows the count of hidden types. Click Show all to restore visibility.
Sorting
Toggle between newest-first and oldest-first with the o key
or the sort button in the header. The arrow icon indicates the
current direction.
Message Navigation
jor↓— next messagekor↑— previous message- Click a message to select it (blue outline)
In-Session Search
Press Cmd+F (or Ctrl+F) to open a search bar within the
current session. Type to find matching text across all visible
messages. The match count and current position are shown in the
search bar.
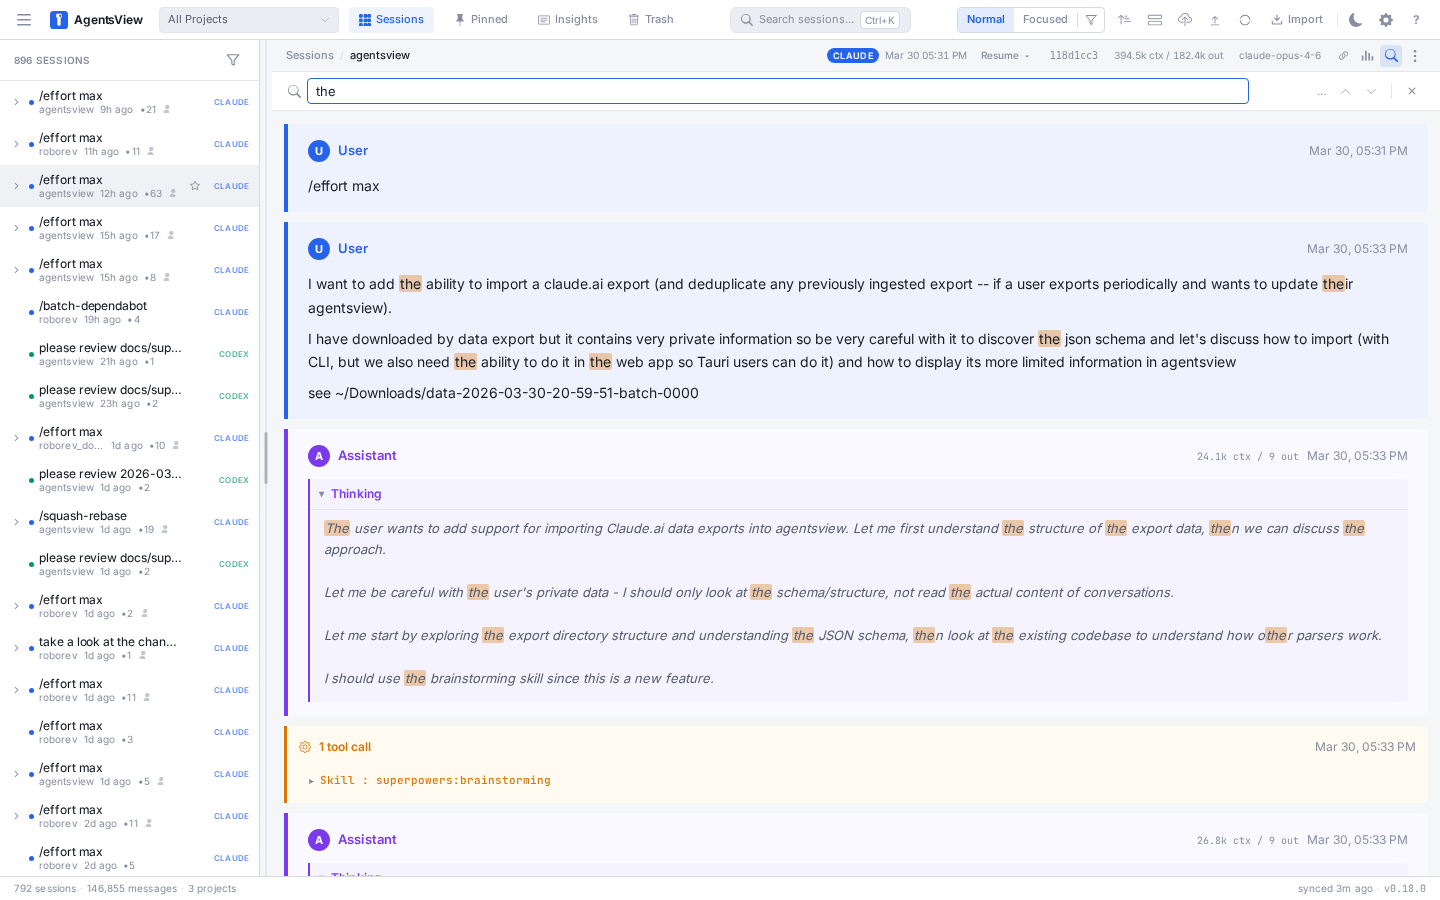
Use the arrow buttons or Enter / Shift+Enter to jump
between matches. The matching message scrolls into view and the
search term is highlighted. Press Esc to close the search bar.
Token Usage
The session detail header displays token usage when available, showing input and output token counts for the session. This gives a quick view of how much context the agent consumed and how much it generated.

Activity Minimap
Click the minimap button in the session header to open a horizontal bar chart showing message activity across the session timeline. Each bar represents a time bucket with user and assistant message counts — taller bars indicate more activity.
Click any bar to jump directly to the first message in that time interval. An active indicator tracks your current scroll position within the session. The minimap adapts its bucket count to the session length, targeting around 30 bars for a readable overview.
Hover over a bar to see the exact time range and message counts. The minimap preference is saved in localStorage.
Progressive Loading
Sessions with more than 20,000 messages load the most recent 1,000 messages first. Older messages load automatically as you scroll up. Smaller sessions load all messages at once.
Live Updates
When viewing an active session, AgentsView uses Server-Sent Events to stream new messages in real time. The message list updates incrementally — only new activity is fetched, rather than reloading the entire session — so updates arrive faster and with less overhead.
Command Palette
Press Cmd+K (or Ctrl+K) to open the command palette — a
full-screen search overlay.
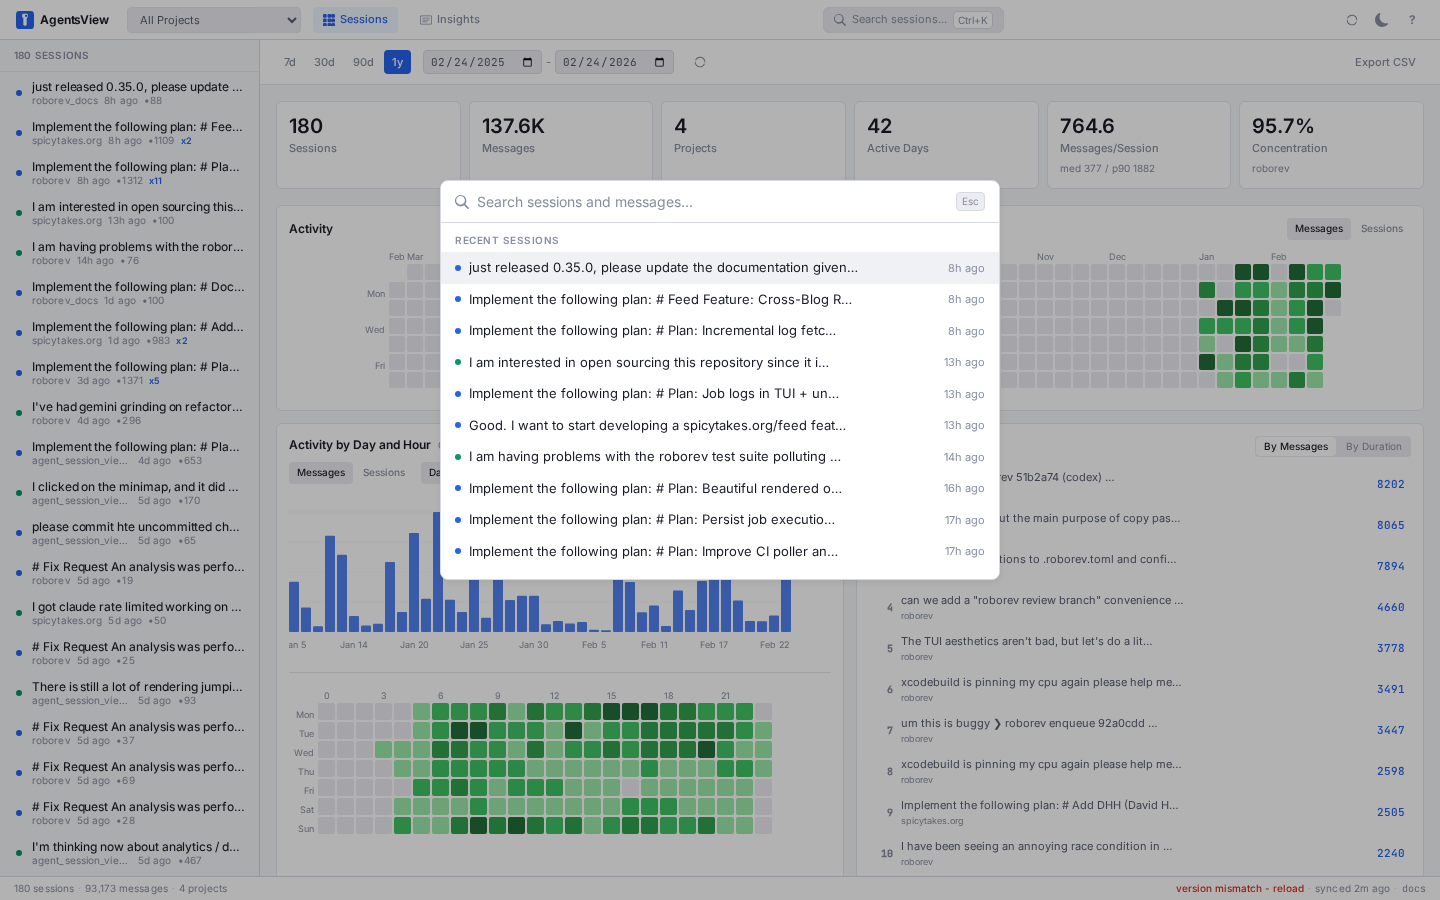
Recent Sessions
With an empty or short query (under 3 characters), the palette shows your 10 most recent sessions. Type to filter by project name or first message.
Full-Text Search
Type 3 or more characters to search across all message content and session names. Results appear in real time with 300ms debounce.
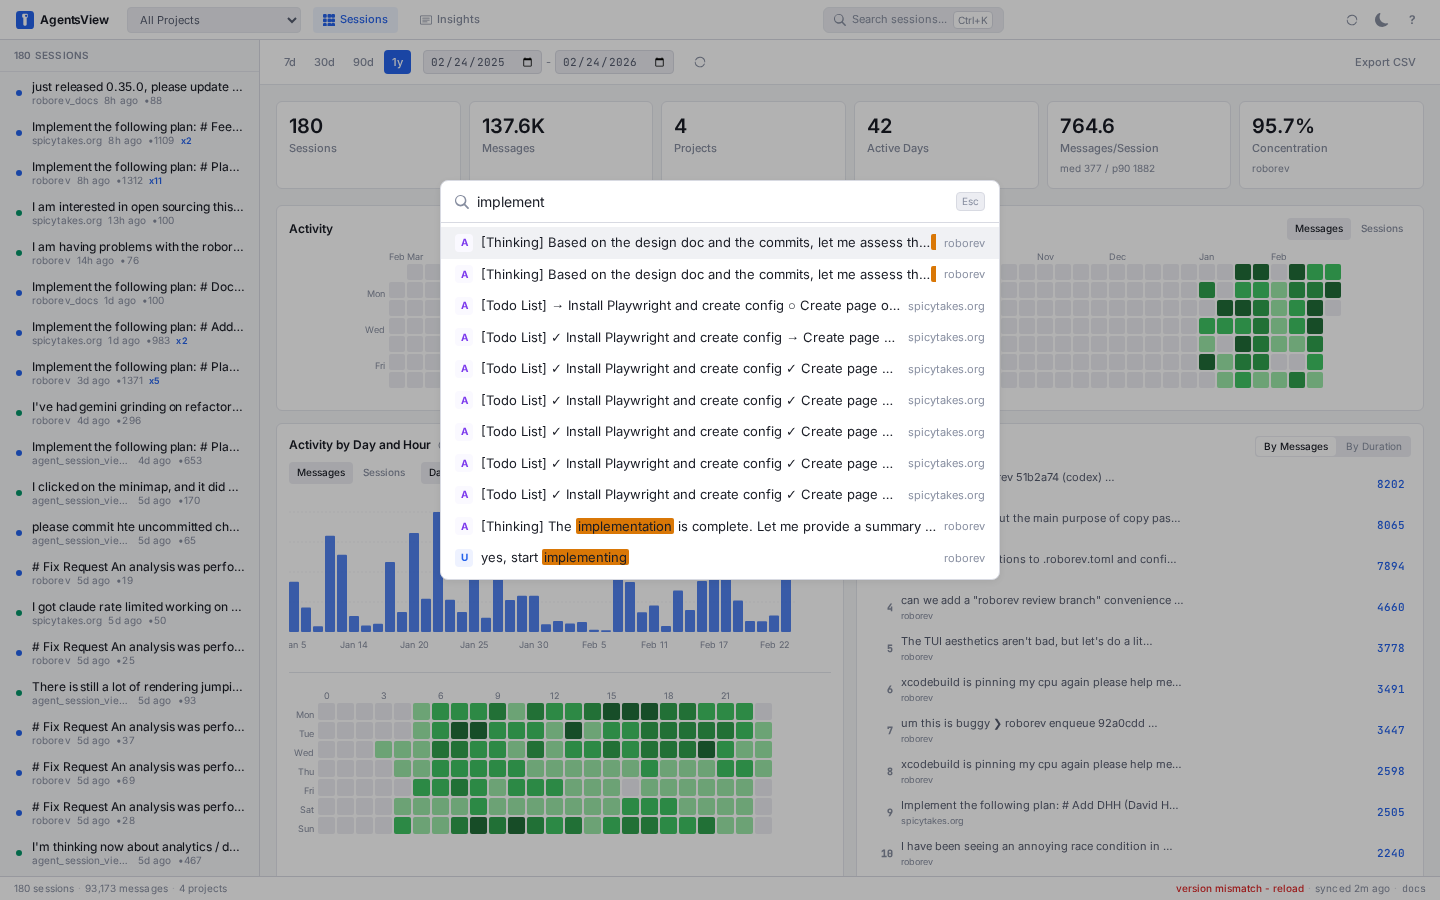
Results are grouped by session — each session shows its best matching result. This prevents a single long session from dominating the results list. The search also matches against session display names and first messages, so you can find sessions by title.
Use the sort toggle in the palette header to switch between Relevance (best matches first) and Recency (newest sessions first).
Each result shows:
- Role badge — U (user) or A (assistant) in a colored box
- Snippet — matching text with highlighted search terms
- Session name — the session this result belongs to
- Project name — right-aligned
Select a result to jump to that session and scroll directly to the matching message.
Keyboard Navigation
↑/↓— navigate resultsEnter— select current resultEsc— close palette
Session Management
Renaming Sessions
Double-click a session name in the sidebar to rename it inline.
You can also right-click a session to open a context menu and
select Rename. Press Enter to save or Escape to cancel. The
custom name persists as a display_name in the database and
overrides the default first-message title.
Trash
Press Del (or Backspace) with a session selected, or
right-click and select Delete, to move it to the trash.
An undo toast appears briefly to let you recover the session
immediately. Trashed sessions are hidden from all listings
and analytics.
Click Trash in the header navigation to view trashed sessions. From the trash page you can restore individual sessions or permanently delete them. Use Empty trash to permanently delete all trashed sessions at once.
Pinned Messages
Click the pin icon on any message header to pin it. Pinned messages are saved to the database and accessible from the Pinned page in the header navigation.
The pinned page shows a gallery-style grid of pinned messages. Each card shows the message content (expandable for long messages), the session and project it belongs to, and actions to copy the content, unpin, or navigate back to the source message in its session.
Session Resume Menu
Right-click a session in the sidebar to open a context menu with three resume actions:
- Reopen — reopen the session in the agent that created it
- Terminal — launch a terminal in the session’s working directory
- Open Directory — open the session’s working directory in Finder (macOS) or Explorer (Windows)
GitHub Copilot CLI and Cursor sessions also appear in the
resume dropdown. Cursor resume resolves the original workspace
path automatically and passes it as --workspace to
cursor agent --resume.
For Claude sessions on macOS, a Claude Desktop option
appears at the bottom of the resume menu. It opens the session
in Claude Desktop’s Code tab via the claude://resume URL
scheme.
These actions let you quickly pick up where you left off without manually navigating to the project directory.
Session Export
Press e or click the export button to download the current
session as a standalone HTML file. The exported file includes
styled message rendering and works offline.
Publish to Gist
Press p or click the publish button to share a session via
GitHub Gist.
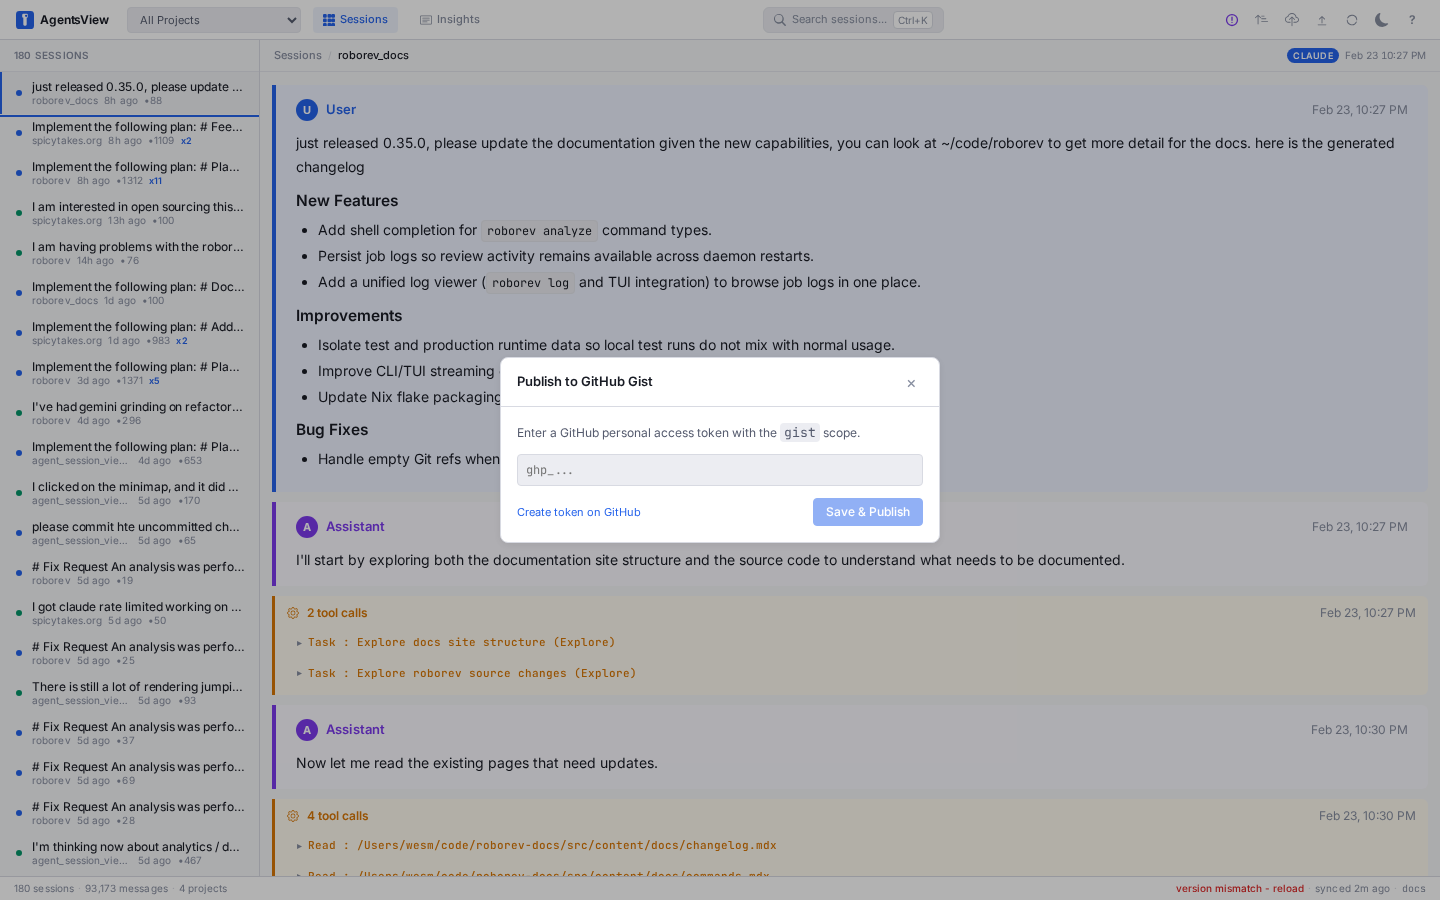
On first use, you’ll be prompted to enter a GitHub personal
access token with the gist scope. The token is saved to your
config file and reused for future publishes.
After publishing, the modal shows two URLs:
- View URL — rendered view of the gist
- Gist URL — direct GitHub link
Both have copy buttons and an “Open in Browser” action.
Session Upload
Upload session JSONL files from other machines via the API:
curl -F "file=@session.jsonl" \ "http://127.0.0.1:8080/api/v1/sessions/upload?project=myapp"Uploaded files are stored in ~/.agentsview/uploads/ and
synced into the database.
Keyboard Shortcuts
Press ? to see all shortcuts in a modal overlay.
| Key | Action |
|---|---|
Cmd+K | Open command palette |
Cmd+F | Search within current session |
Esc | Close modal / deselect session |
j / ↓ | Next message |
k / ↑ | Previous message |
] | Next session |
[ | Previous session |
o | Toggle sort order |
l | Cycle message layout |
s | Star / unstar current session |
Del | Delete / archive selected session |
r | Trigger sync |
e | Export session |
p | Publish to Gist |
? | Show shortcuts |
Shortcuts are disabled when typing in an input field. Esc
always works.
Settings
Click the gear icon in the header to open the Settings page. Settings are organized into tabs:
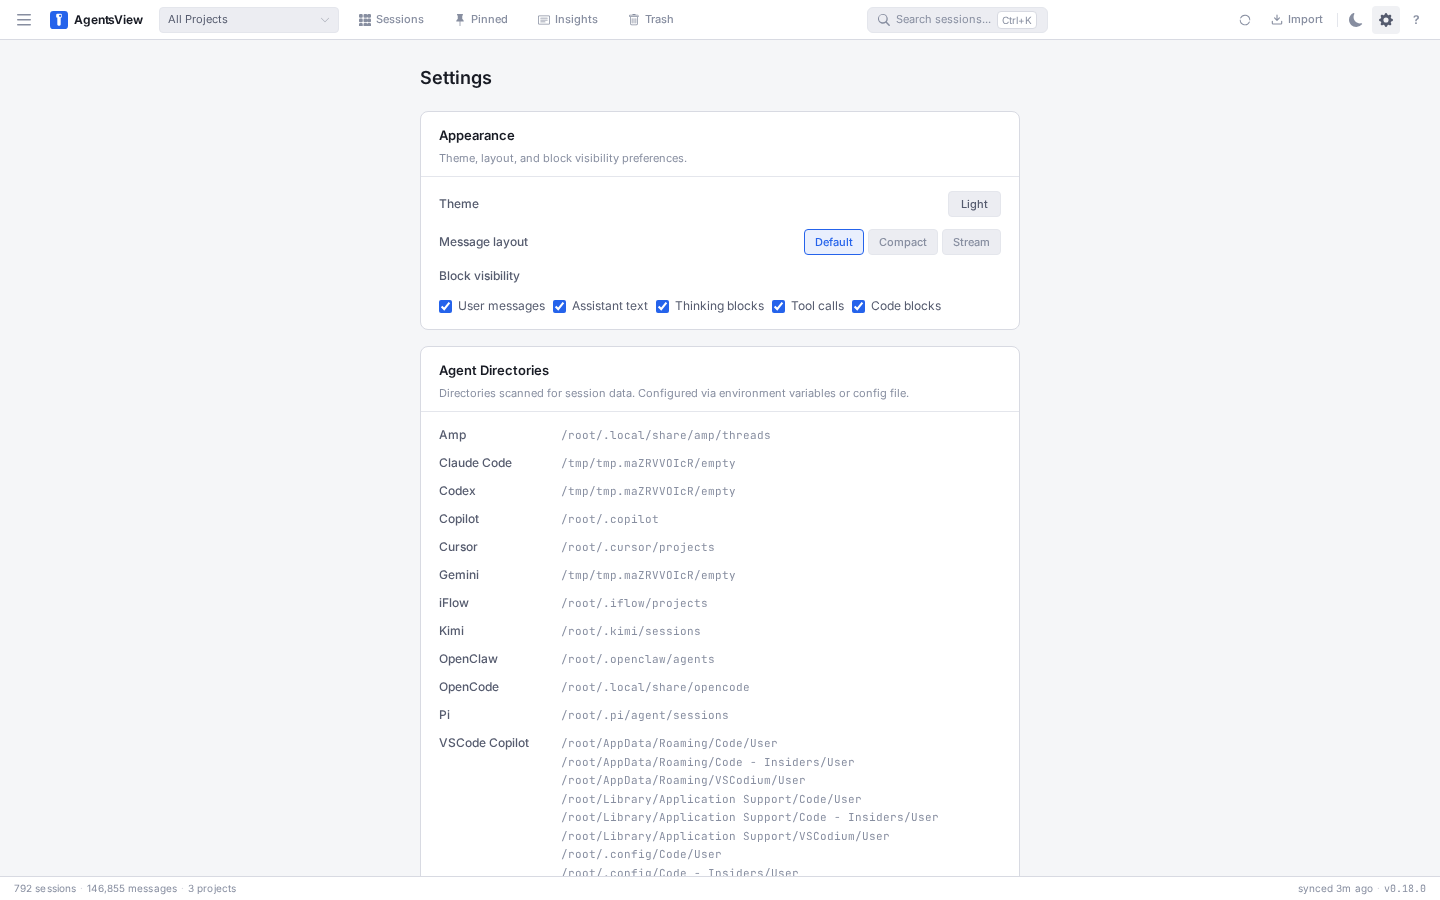
| Section | What You Can Configure |
|---|---|
| Appearance | Theme (light/dark), block visibility, desktop zoom level |
| Terminal | Default terminal emulator for session resume |
| GitHub | Personal access token for Gist publishing |
| Agent Directories | Custom paths for each agent’s session files |
| Remote Access | Remote connections toggle, auth token, connect to remote server |
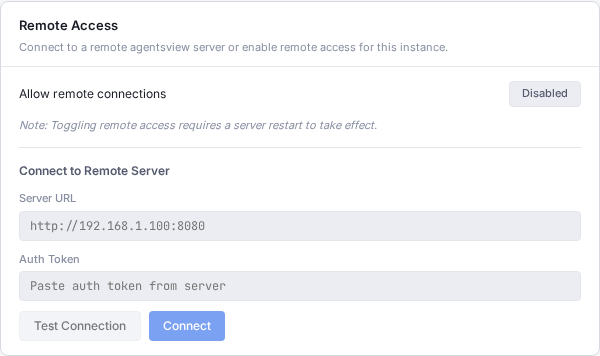
Changes are persisted to ~/.agentsview/config.toml and
survive restarts. See Remote Access for
details on the remote access settings.
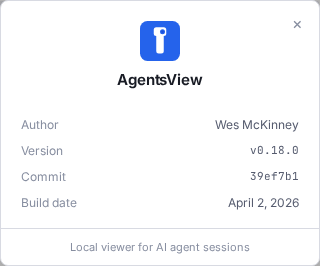
About Dialog
Click the version number in the status bar or select About from the header menu to open the About dialog. It shows the current version, build date, git commit, and links to the changelog and GitHub repository.
Desktop Zoom
In the desktop app, use Cmd+Plus and Cmd+Minus (or
Ctrl+Plus / Ctrl+Minus on Windows) to zoom in and out.
Cmd+0 resets to the default zoom level. The zoom level can
also be set in the Settings page under the Appearance tab.
Theme
Click the theme toggle in the header or go to Settings > Appearance to switch between light and dark mode. The preference is saved and persists across sessions.
Iframe Embedding
When embedding AgentsView in an iframe, the parent page can
control the theme via postMessage:
iframe.contentWindow.postMessage( { type: "theme:set", theme: "dark" }, "*");Accepted values for theme are "light" and "dark".
Sync
AgentsView automatically syncs session files on startup and watches for changes in real time. The sync status is shown in the status bar:
- Syncing indicator — green text showing progress percentage and phase (“Scanning [project]…” or parse progress)
- Last sync time — relative timestamp (“synced 2h ago”) that updates automatically. Hover to see the exact sync timestamp.
Press r to trigger a manual sync. The sync button in the
header shows a spinning animation while syncing.
The status bar also shows a version mismatch warning (red) if the frontend and backend versions differ. Click it to reload.
Full Resync
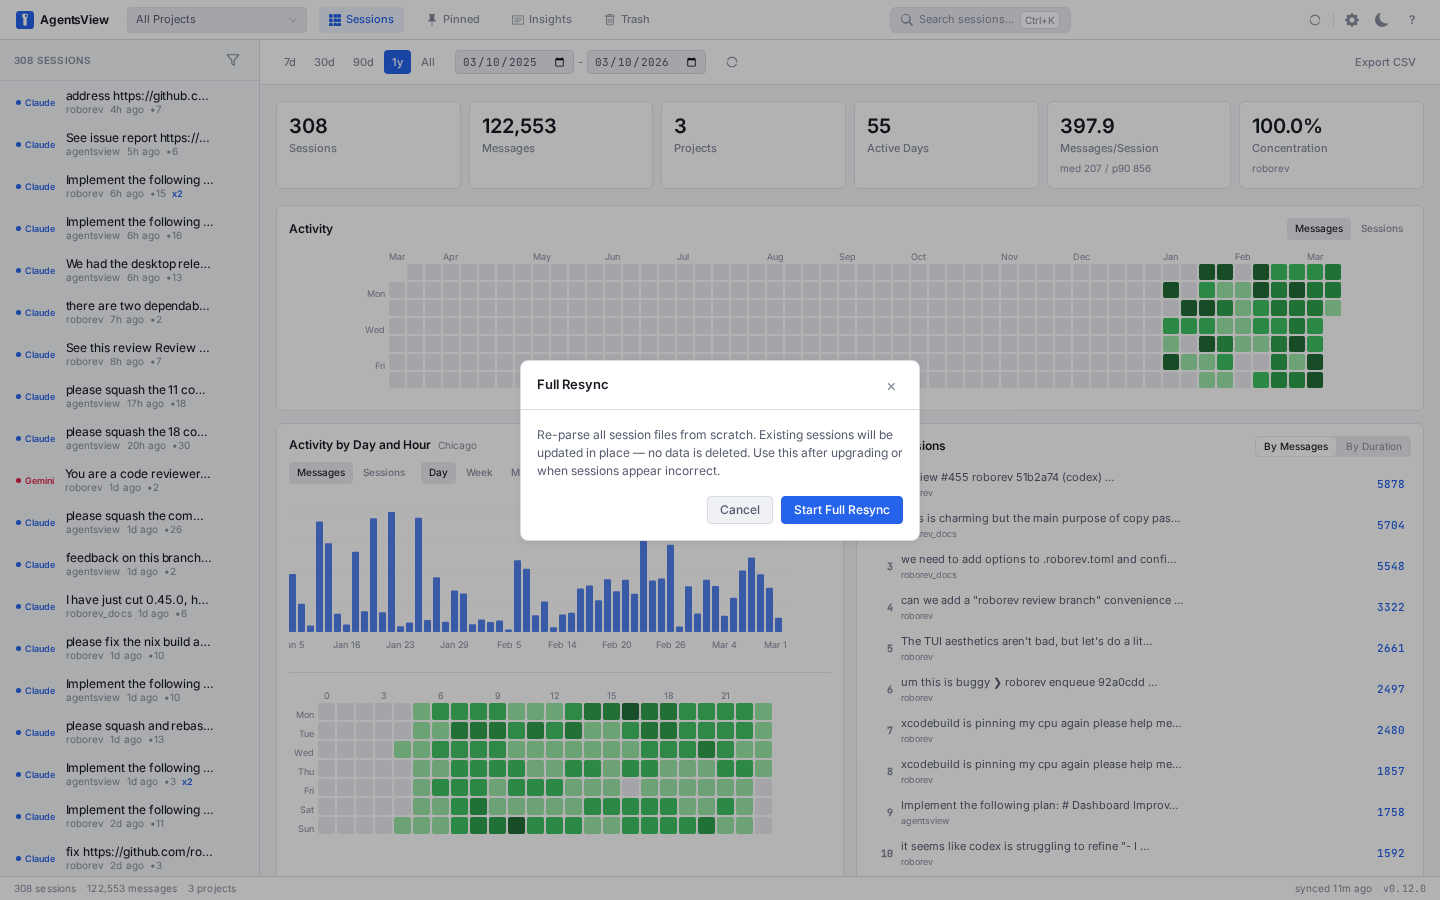
Click the gear icon in the header to open the Full Resync modal. This re-parses all session files from scratch using a non-destructive flow — existing session data is preserved and orphaned sessions (those no longer present on disk) are carried forward. This is useful after upgrading AgentsView or when sessions appear to be parsed incorrectly.
The modal shows live progress as sessions are processed:
- Confirm — describes what the resync does, with Start and Cancel buttons
- Progress — live counter and progress bar (“Syncing X / Y sessions…”). The modal stays open until the resync finishes.
- Done — shows synced, skipped, and total session counts
- Error — if the resync fails, shows the error with Retry and Close buttons